Press Kit
Background, current figures, and screenshots for reporters covering Arkansas school funding.
Boilerplate
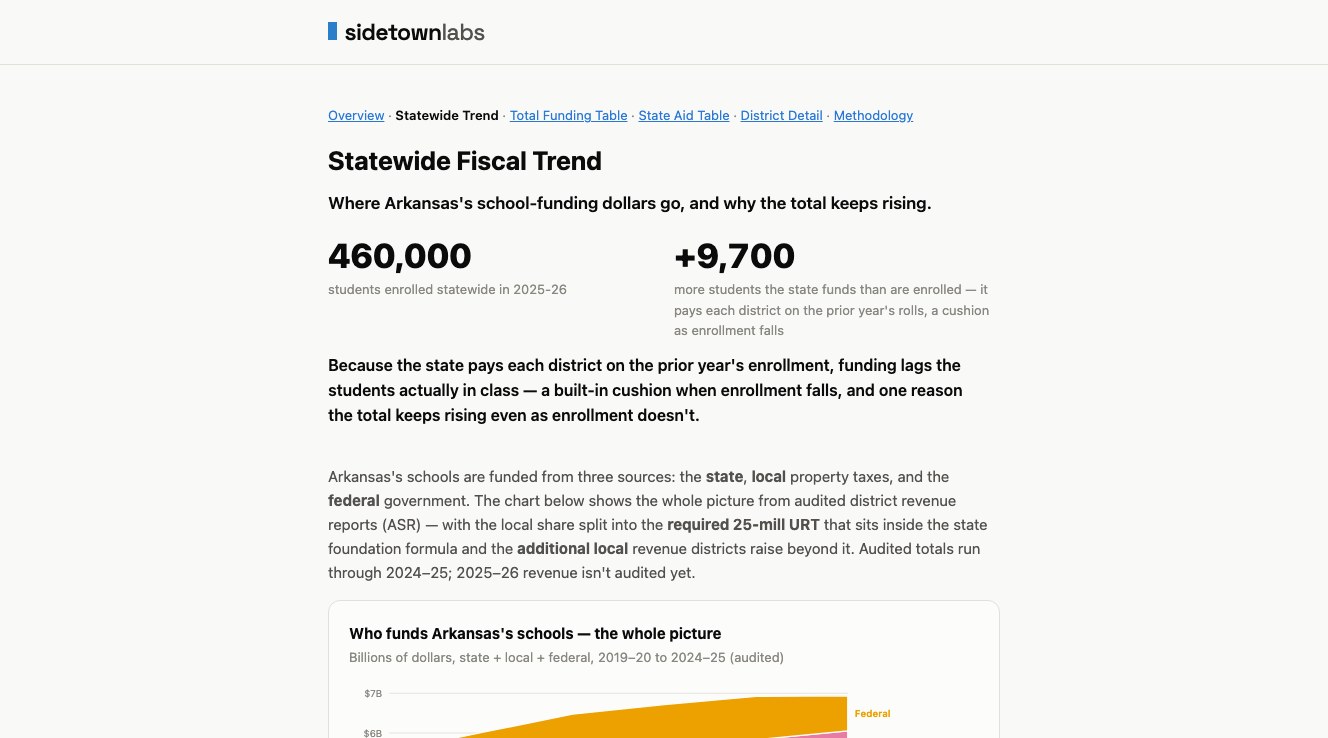
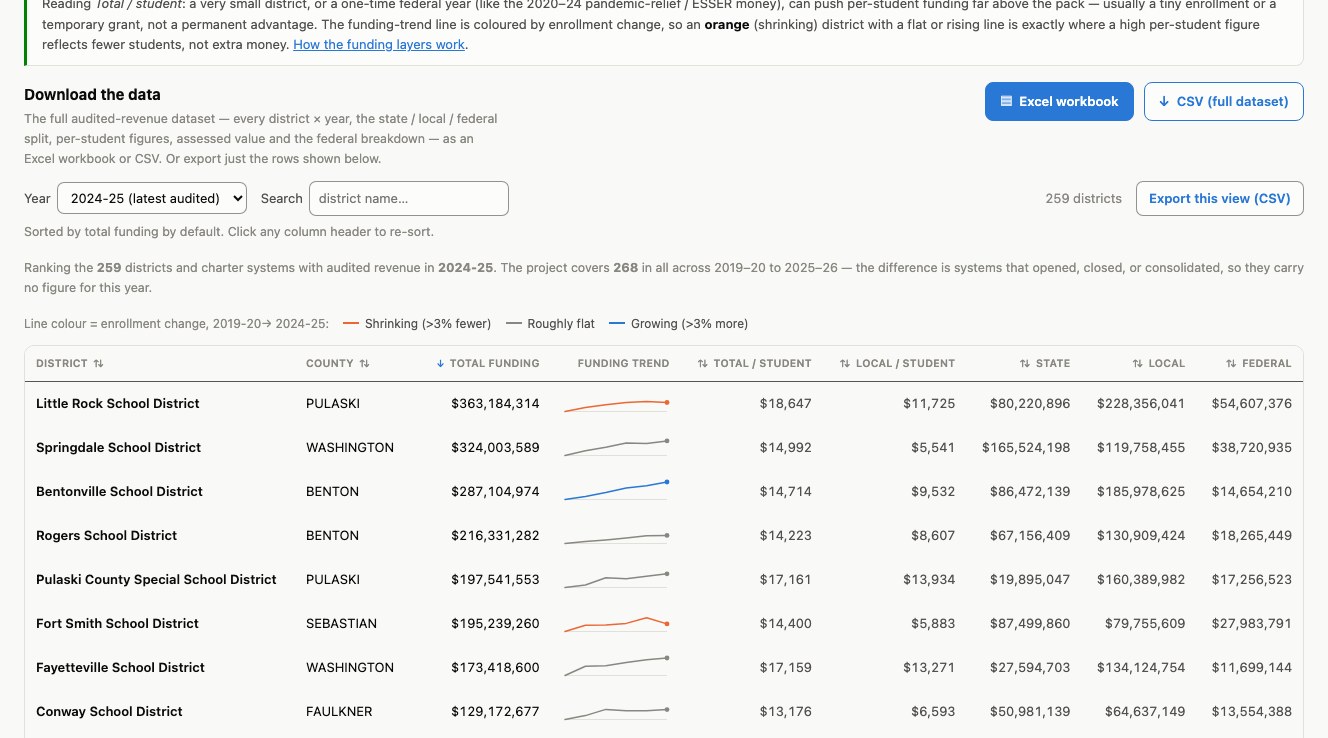
Arkansas Fiscal Mechanics traces every dollar of Arkansas state school aid to the statutory formula that produced it, then checks the result against the state's own payment records. It covers all 268 districts and charter systems across 2019-20 through 2025-26, and sets that formula-derived state aid alongside audited state, local, and federal revenue totals from districts' Annual Statistical Reports. Across the whole payment record, 99.6% of every state-aid dollar is re-derived from its formula or matched to a published statutory table; the remaining 0.4% is shown exactly as the state reported it. The project's central mechanic is Arkansas's one-year funding lag: the state pays each district on its prior year's three-quarter average daily membership, which is why total funding can keep climbing while enrollment doesn't.
Current figures
Foundation-rate figures reflect 2025-26; revenue figures reflect 2024-25, the most recent audited year. These numbers will change as future years are added; check the live site before publishing rather than treating this page as permanently current.
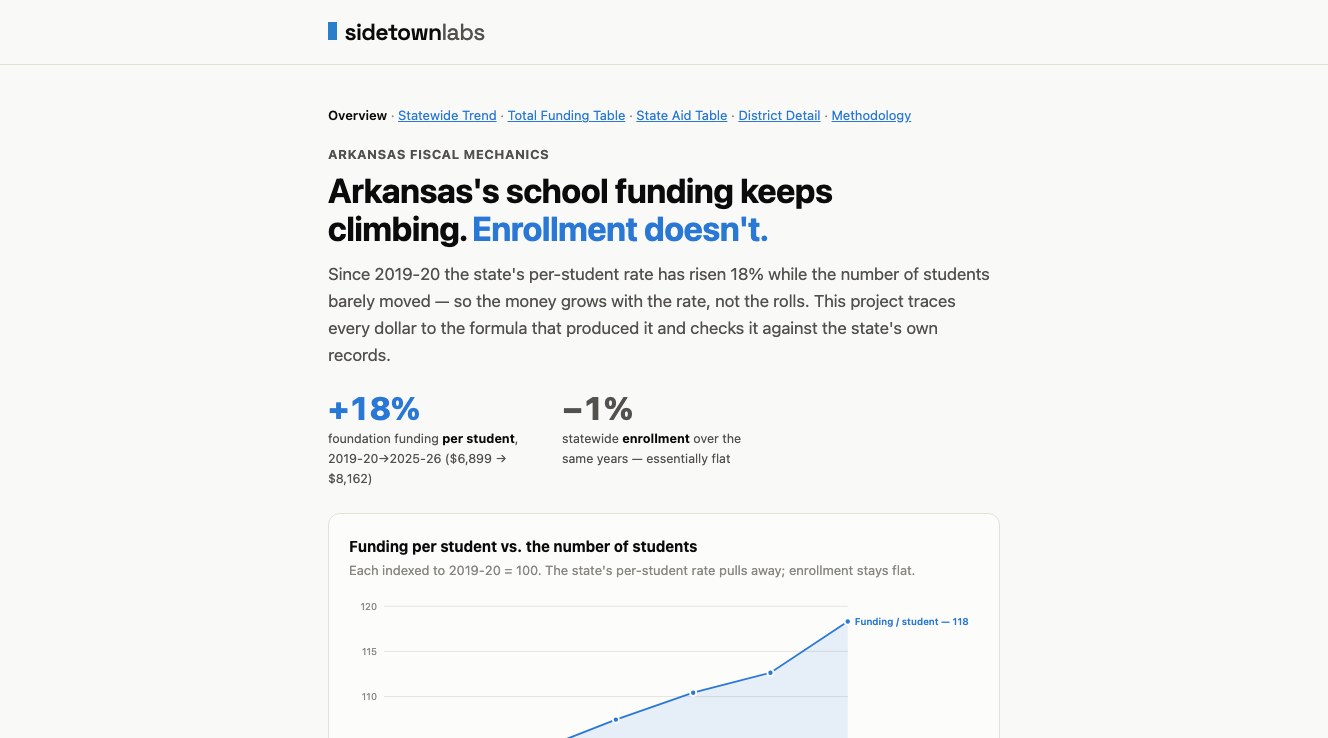
- +18% foundation funding per student, 2019-20 to 2025-26 ($6,899 to $8,162).
- −1% statewide enrollment over the same years — essentially flat.
- 99.6% of state-aid dollars re-derived from formula or matched to a published statutory table.
- $6.94B total school revenue in 2024-25 — state, local, and federal combined, from audited district reports.
Screenshots
Citation and license
Rush, Joel. Arkansas Fiscal Mechanics. Sidetown Labs, 2026. https://arkansas-fiscal.sidetownlabs.com/.
© 2026 Joel Rush / Sidetown Labs. All rights reserved. Screenshots, excerpts, and printed copies for schools, districts, co‑ops, school boards, press, and research are welcome with attribution; any other use — including republication, redistribution, derived versions, or commercial use — requires permission (joelrush@gmail.com). The underlying figures are public records; no claim is made over the facts themselves. How each figure is produced and how far it is verified: Methodology and Technical / verification.
Press contact
Press contact: joelrush@gmail.com.